
Created in collaboration with Damiano and Daniele, this project evaluates global mid-term progress toward the United Nations 2030 Agenda for Sustainable Development, adopted in 2015. Using harmonized indicators from Our World in Data (UN, World Bank, OECD, IMF, ILO), we designed three interactive Tableau dashboards focused on Goal 8, Goal 9, and Goal 11.
Goal 8 — Decent Work and Economic Growth
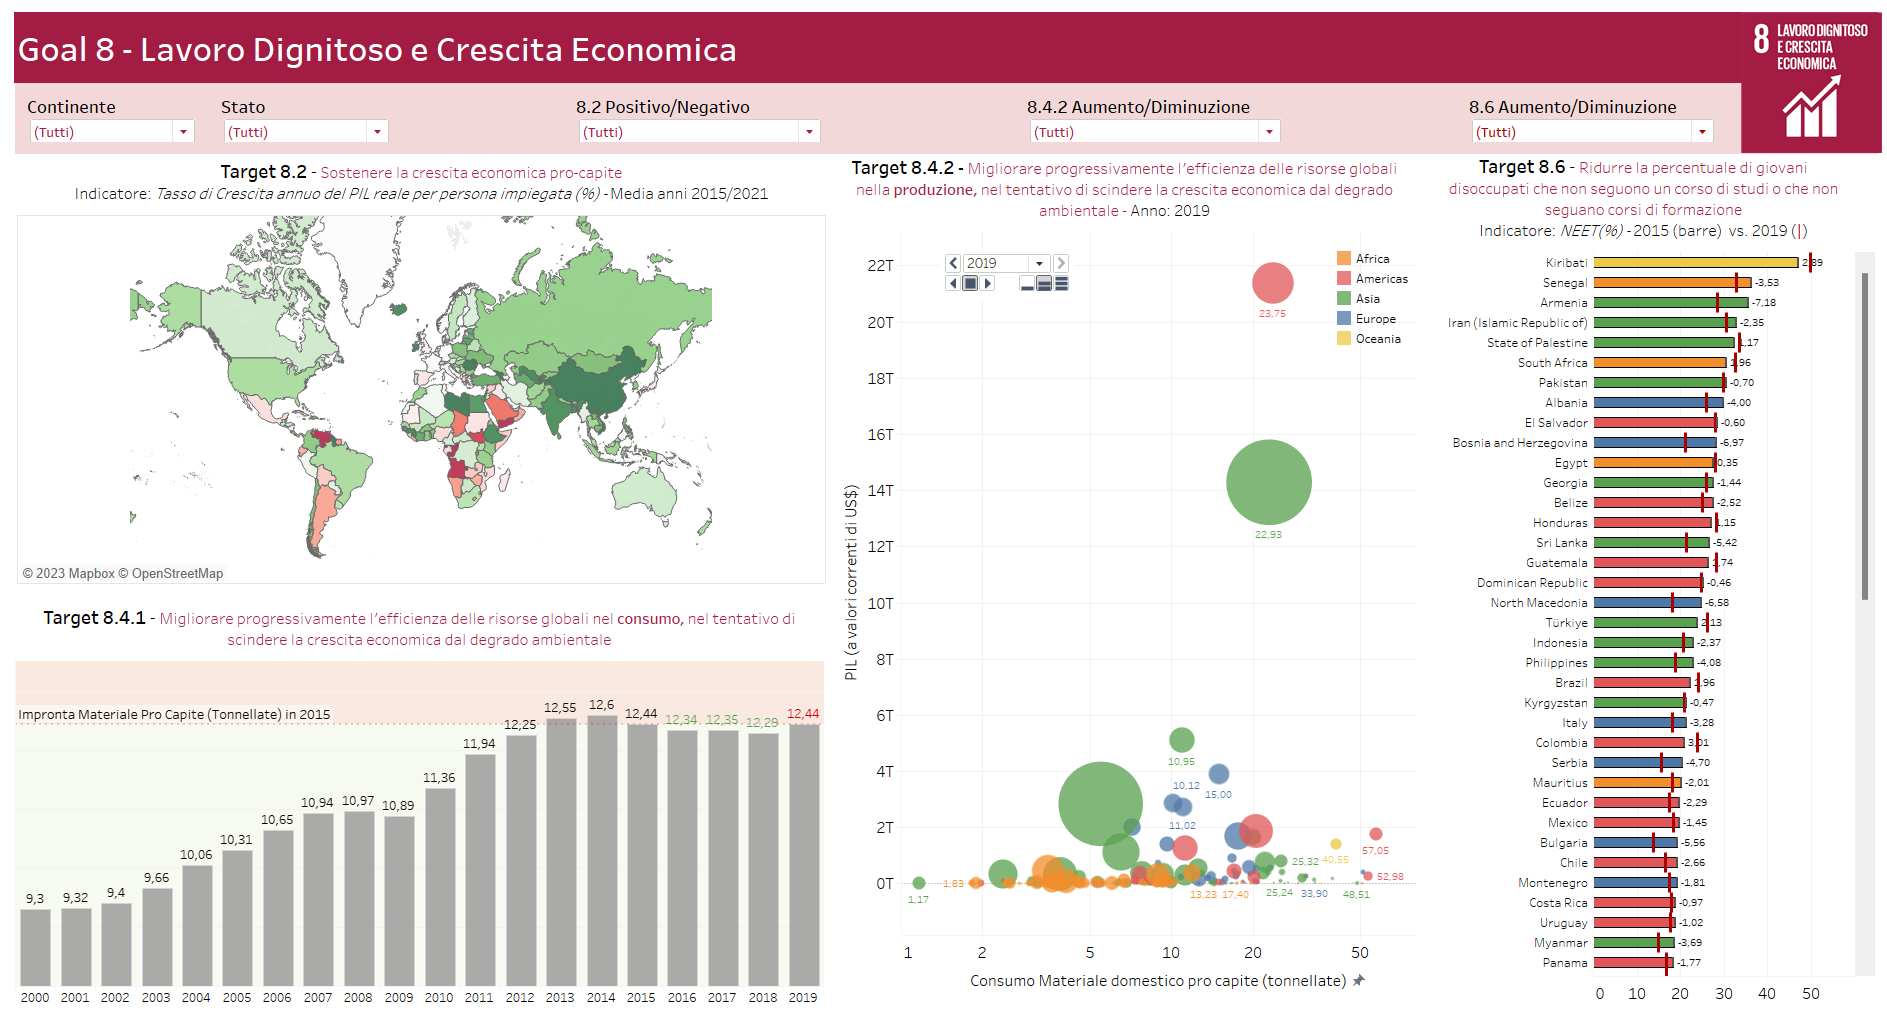
- GDP Growth per Employed Person (2016–2021): Highlights strong positive productivity growth across Asian economies, contrasted with stagnant pre- and post-pandemic growth in Italy (-0.2% average).
- Material Footprint per Capita: Global resource consumption averaged 12.44 tonnes per person in 2019, showing that economic expansion in emerging economies remains tightly coupled with domestic material consumption.
- Youth NEET Rate (2015 vs. 2019): Tracks the share of young people Not in Education, Employment, or Training, where Italy ranked fourth highest in Europe (improving from 21% in 2015 to 18% in 2019).
Goal 9 — Industry, Innovation and Infrastructure
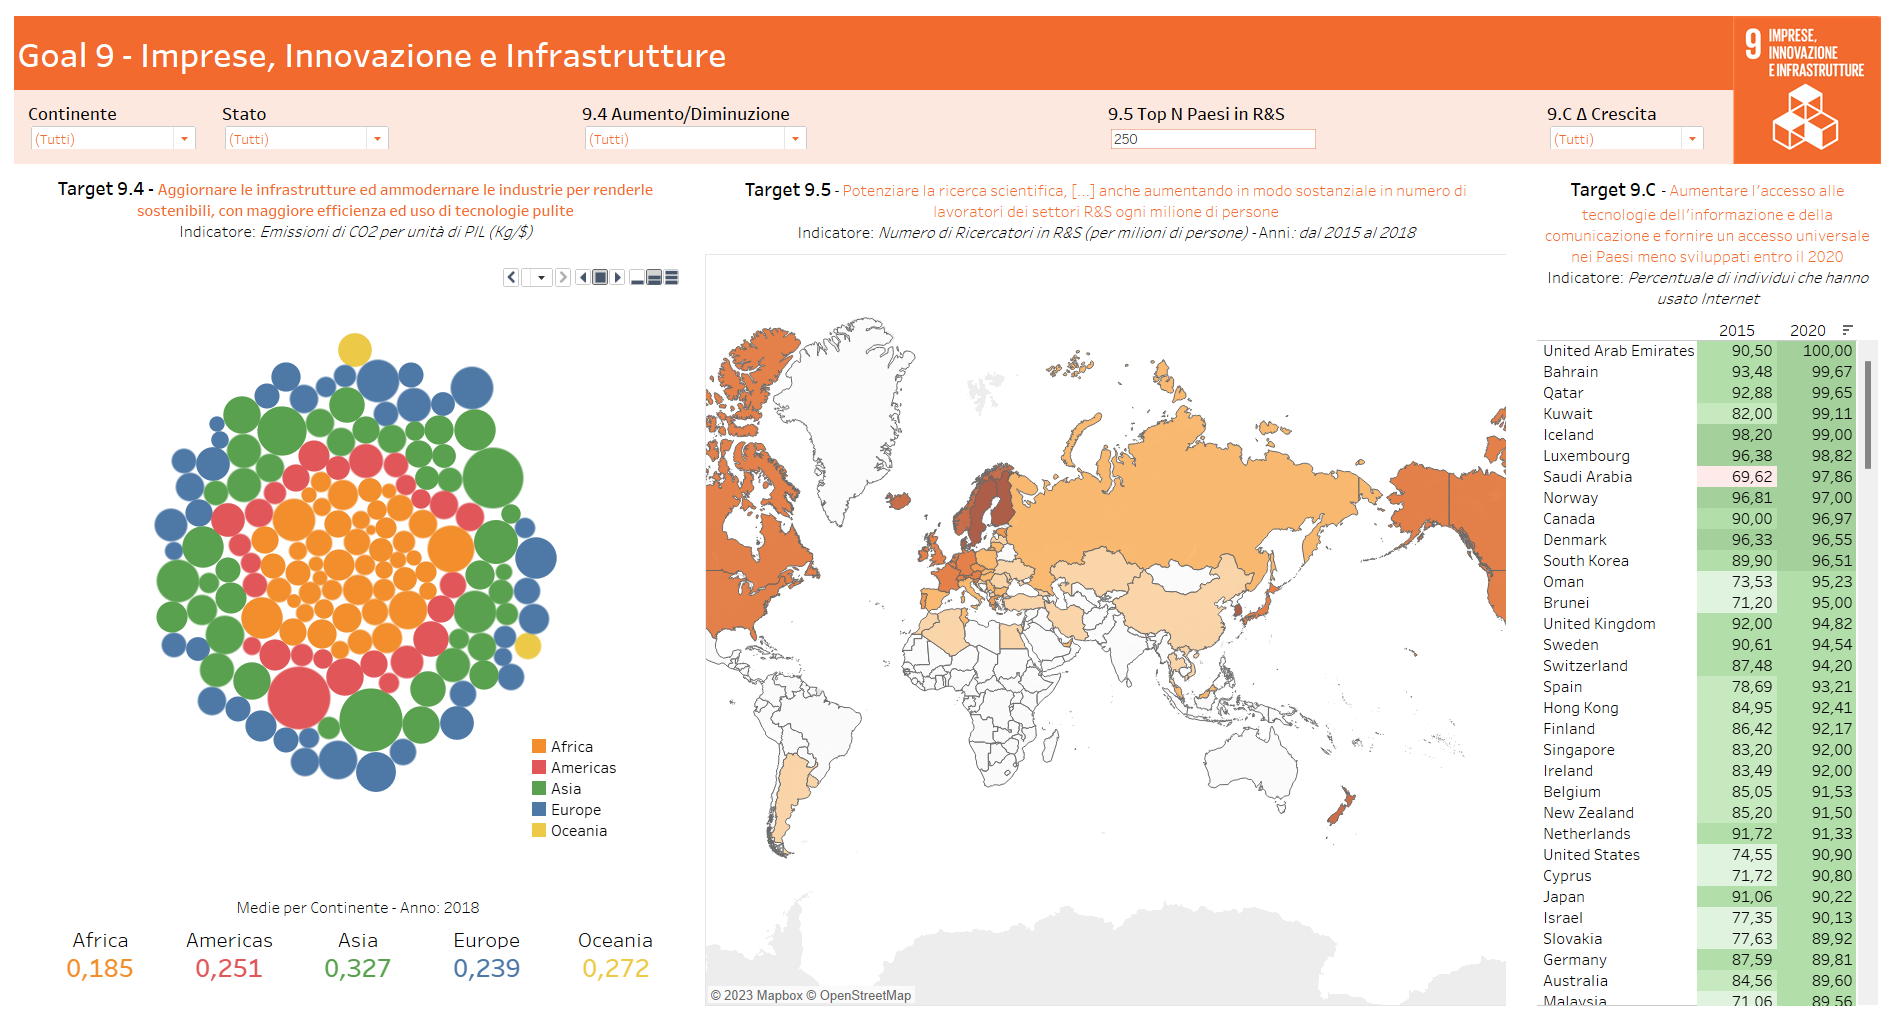
- Carbon Intensity of GDP ( per USD): Compares emissions efficiency across continents (0.327 kg/$ in Asia vs. 0.239 kg/$ in Europe and 0.251 kg/$ in the US in 2018), with Italy outperforming the European average at 0.168 kg/$.
- R&D Researchers per Million Inhabitants: Highlights the gap between Nordic/East Asian innovation leaders (Denmark at ~8,000 researchers per million) and Italy (36th globally at ~2,300 researchers per million).
- Universal Internet Access (2015 vs. 2020): Tracks digital infrastructure adoption across developing regions.
Goal 11 — Sustainable Cities and Communities
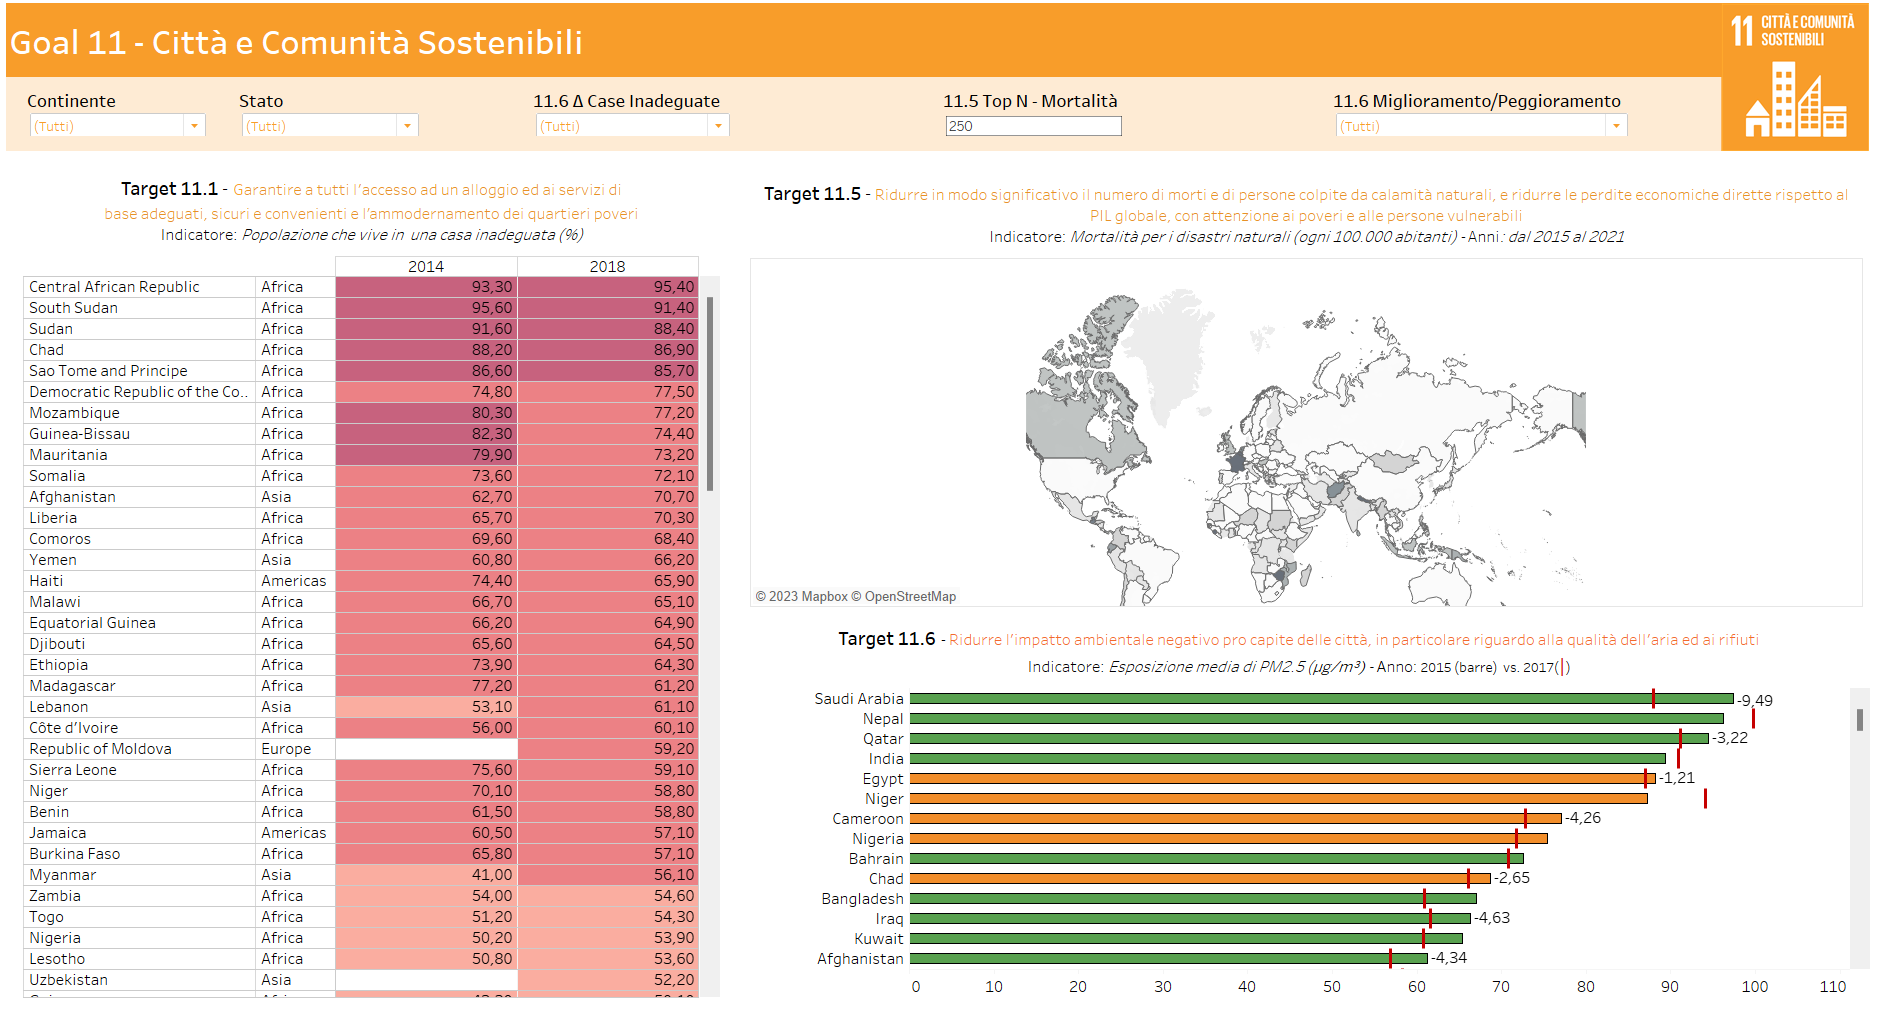
- Urban Living Standards & Housing Deprivation (2014–2018): Measures the share of populations living in overcrowded housing or lacking clean water and sanitation.
- Human & Economic Cost of Natural Disasters: Contrasts heatwave mortality in Europe with extreme hurricane-related economic damages in the United States (~90B USD/year average from 2016 to 2021).
- Air Pollution Exposure: Compares population exposure across income tiers and energy regimes.
← Back to Projects
Share article: