
Developed in collaboration with Damiano and Daniele, this project explores the European electricity sector across three dimensions: internal power generation mix, cross-border electricity trade & socio-economic impact, and environmental emissions & plant efficiency.
Objectives & Data Sources
- Objectives:
- Visualize the electricity production mix across European countries (2016–2022).
- Analyze intra-European cross-border energy imports, exports, and grid dependency.
- Quantify the environmental and public-health impact of the power sector.
- Data Sources (Eurostat & Joint Research Centre - JRC):
- Domestic electricity generation by source (Fossil, Nuclear, Geothermal, Solar, Wind, Hydro).
- Cross-border physical imports and exports.
- Socio-economic indicators (household/industrial electricity prices, GDP per capita, gender employment ratios).
- Geolocation, generation efficiency, and / / emissions of European power plants.
1. Energy Generation Mix Dashboard
Italy Energy Mix (2022)

The Energy Mix dashboard tracks each European country’s domestic production across the six primary sources: Fossil, Nuclear, Geothermal, Solar, Wind, and Hydroelectric.
- Top KPIs: Compare national shares against European averages, track the ratio of Green + Nuclear vs. Fossil generation, and measure annual per-capita electricity consumption alongside the green energy consumption share.
- Seasonality & Composition: For Italy in 2022, natural gas remained the dominant fossil source, while the 2016–2022 monthly time series highlights clear seasonal patterns—summer peaks for solar and hydroelectric generation, spring/autumn peaks for wind, and steady baseload output from geothermal plants.
Germany Energy Mix (2022)
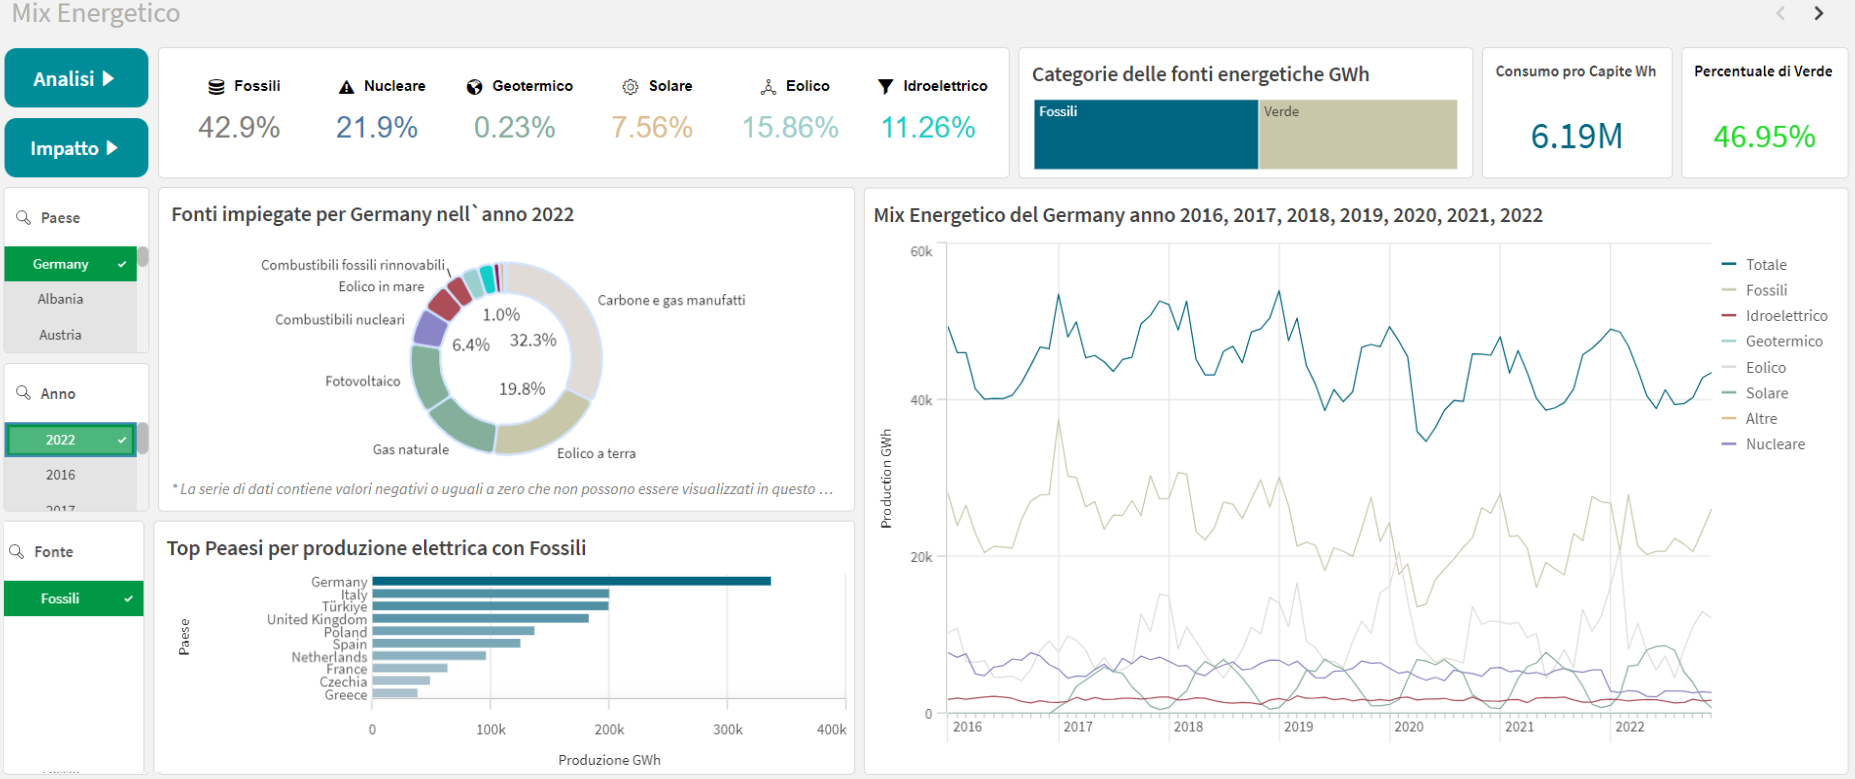
In Germany, per-capita electricity consumption reached 6.19 MWh (-11.5% vs. 2016). In 2022, 46.95% of German consumption came from green sources (+14.72% over 7 years), driven by wind and solar expansion as nuclear capacity was phased out.
2. Commercial Trade & Socio-Economic Analysis
Italy Trade Balance (2021)

The Commercial Analysis dashboard evaluates external energy dependency and household price burdens:
- In 2021, Italy was a net electricity importer of 43 TWh (primarily from Switzerland and France), with foreign dependency increasing by 15.56% since 2016.
- Between 2011 and 2015, household electricity costs in Italy rose by 25% while GDP per capita declined by 4.3%, making energy affordability an increasingly critical macroeconomic factor.
France Trade Balance (2021)
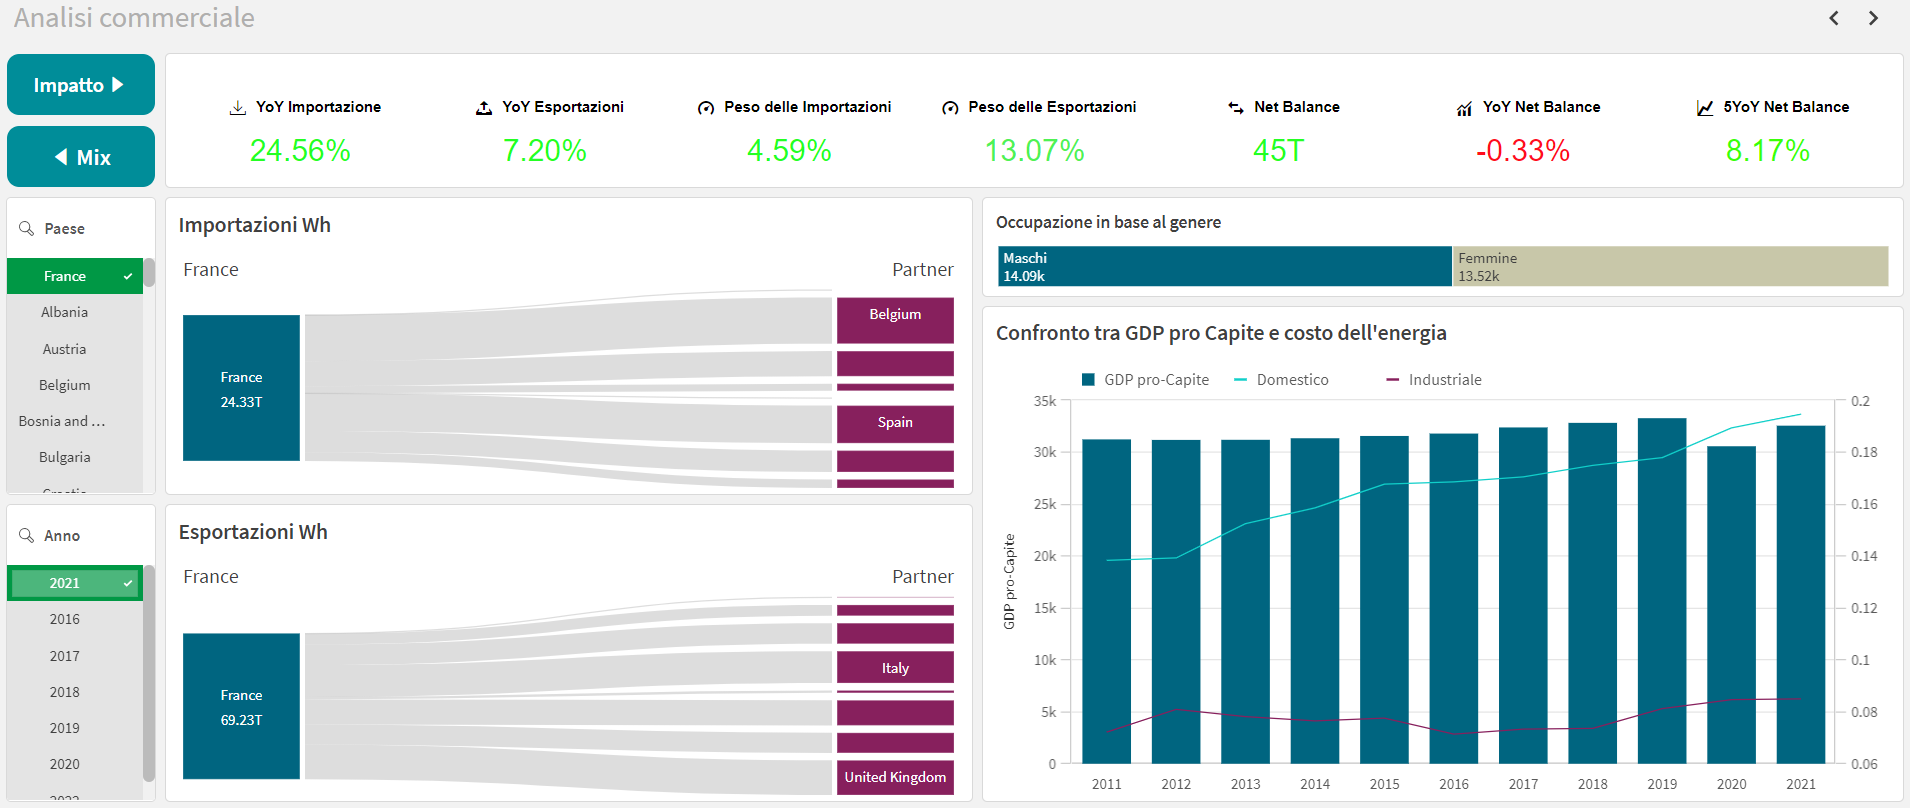
By contrast, France maintained a positive net trade surplus of 45 TWh in 2021 (+8.17% over 5 years), confirming its position as Europe’s largest electricity exporter to Italy, the UK, Belgium, and Spain.
3. Environmental Impact & Power Plant Geolocation

The third dashboard evaluates national grid efficiency, the decarbonization index (indexed to in the year 2000), and intensity by plant type, alongside geospatial mapping of individual European power plants:
